Articles

Home/Articles

AFIA: Forget Finger Pointing; Focus on Facts of GHG Emissions

In an effort to provide clarity on the clouded topic of greenhouse gas emissions, a recent report out of the University of California, Davis, focuses on animal agriculture’s contribution to GHG–believed to drive climate change–challenging naysayers with surprising and encouraging new evidence.

In an effort to provide clarity on the clouded topic of greenhouse gas emissions, a recent report out of the University of California, Davis, focuses on animal agriculture’s contribution to GHG–believed to drive climate change–challenging naysayers with surprising and encouraging new evidence.

The American Feed Industry Association strongly backs the “Livestock’s Contribution’s to Climate Change: Facts and Fiction” white paper, which states globally and in the U.S., energy production and use, as well as the transportation sector, are the largest anthropogenic contributors of GHG. The document, produced by UC-Davis’ Frank Mitloehner, Ph.D., details research from the U.S. Environmental Protection Agency stating animal agriculture contributes only 4.2 percent GHG emissions, not the 18 percent to 51 percent often wrongfully cited.

“Comparing the 4.2 percent GHG contribution from livestock to the 27 percent from the transportation sector, or 31 percent from the energy sector in the U.S., brings all contributions to GHG into perspective,” wrote Mitloehner in the document.

“It is no wonder why there is so much confusion today surrounding the topic of greenhouse gases. With anti-agriculture groups shouting inaccurate data about ‘cows causing climate change’ and ‘ag being to blame,’ it is hard for anyone to focus on, or even to find, the facts,” said AFIA President and CEO Joel G. Newman.

However, the facts are clear, especially surrounding where the most effective opportunities are for decreasing GHG emissions in various sectors, adds Newman. The white paper denounces “Meatless Mondays,” stating the program is not as efficient as its advocates lead the public to believe.

If all Americans practiced Meatless Mondays, only a 0.6 percent reduction of GHG emissions would be seen in the U.S. If the U.S. population instead replaced their incandescent lightbulbs with Energy Star bulbs, double the reduction would be seen (1.2 percent).

“One certainly cannot neglect emissions from the livestock sector, but to compare them to the main emission sources would put us on a wrong path to solutions, namely to significantly reduce our anthropogenic carbon footprint to reduce climate change,” Mitloehner stated in the paper.

“It may come as a surprise, but the U.S. livestock sector–looked at on a global scale–has the lowest carbon footprint per unit of livestock produced (i.e. meat, milk, eggs). We want to educate others in the feed, livestock and poultry sectors worldwide on using research, new technologies and best practices to achieve this as well,” said Newman.

To accurately and fairly assess emissions, as well as identify an overall path toward providing abundant food for years to come, Mitloehner and AFIA are part of a multi-stakeholder partnership project hosted by the […]
By |2016-07-08T15:45:25-05:00July 8th, 2016|Articles|0 Comments

World’s Worst Performing Economies In 2016

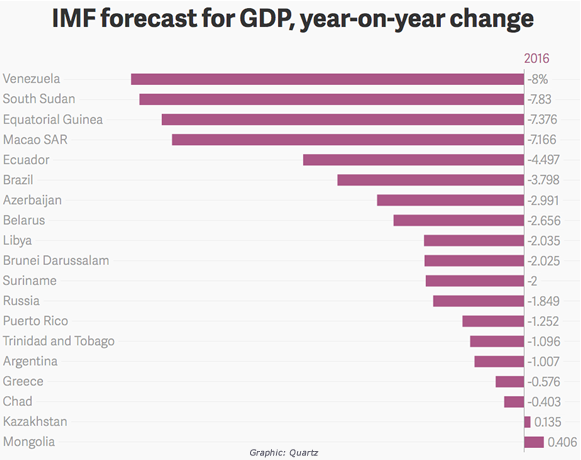
The IMF last week made its second cut to global growth forecasts, predicting a rate of +3.2% this year and +3.5% in 2017, having previously forecast 3.4% and 3.6% respectively. They noted that downside risks to the global economic outlook have increased since October, “raising the possibility of a more generalized slowdown and a sudden pull-back of capital flows.” Looking at the graph below showing the countries expected to be the worst performers, it’s pretty easy to draw some conclusions as to what the main trouble are – plummeting oil and commodity prices are a consistent theme for nearly all of the worst performers, joined by fiscal mismanagement and political turmoil. 

IMF forecast for GDP, year-on-year change

By |2016-04-18T08:43:36-05:00April 18th, 2016|Articles|0 Comments

Morning Summary

U.S. stocks have enjoyed their sixth straight week of moving higher, while oil prices have now erased all of their gains on the year. Ironically, oil rig counts here in the U.S. are at the lowest levels since Baker Hughes started counting oil rigs back in 1944. The trade clearly seems tripped up by the glut of global oil production. Recent comments from Saudi Arabia saying they would only freeze production if all major oil producers, including Iran, commit to doing the same. Iran has steadfastly maintained they will not entertain a freeze until their crude production reaches pre-sanction levels of 4-million barrels per day. Over the weekend, Iran’s oil minister announced the country’s oil and gas condensate exports have now surpassed 2-million barrels per day for the first time since sanctions were lifted. That works out to an increase of around +250,000 barrels per day since March 1. In other words the world is still swimming in a glut of supply while Iran is in the process of trying to add more barrels. Traders here at home have been digesting a wave of economic data as of late, which most argue has been fairly positive. I have to admit myself, while I remain a bit apprehensive in regard to being an outright raging stock market bull, there is evidence and recent talk that the “shallow manufacturing recession” is starting to subside. Remember we had manufacturing numbers expanding for the first time in seven months last week. More positive news is the fact the U.S. dollar continues to weaken in 2016 on talk from a apparently more dovish Fed. Pending U.S. home sales are also starting to increase, and mortgage purchasing applications most recently are up over +20% compared to last year. Keep in mind mortgage rates haven’t made new lows in over 3-years, but purchasing applications are picking up momentum, meaning perhaps the housing market is stronger than many are currently forecasting? Another positive is the fact even though gas prices at the pump have risen form an average low of $1.69 per gallon to now over $2.05 per gallon, our average four-week usage year-over-year is up +5%. There’s also evidence that Consumer Spending is starting to gain a bit more traction. Like I said, I’m not wildly bullish, in fact I still only have about 30% of my current portfolio invested in long equity positions, but I do believe some of the fear has been eliminated or at least temporarily subsided as the market evolves and adjust to the changing dynamics. To some degree the dollar strength feels like it has been digested, the commodity price slide has somewhat stabilized, and consumers are starting to spend a bit more of their energy savings in the economy. The week ahead will bring a much lighter economic calendar, but with heavier focus being placed on the U.S. Fed. We will hear multiple speeches form Fed Presidents and key members, as well as digesting on Wednesday the “minutes” from their recent March meeting. On Thursday there’s a historic event in New York featuring Fed chair Janet Yellen and all her living predecessors: Paul Volcker, Alan Greenspan and […]

By |2016-04-04T08:06:25-05:00April 4th, 2016|Articles|0 Comments

Eggs Prices Up, Salad and OJ Down

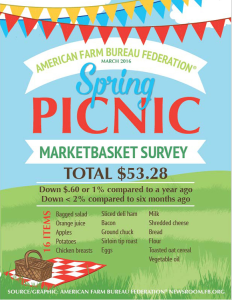
The American Farm Bureau Federation’s Spring Picnic Marketbasket Survey decreased from last year thanks to lower prices for several foods, including salad, orange juice, shredded cheddar, ground chuck, sirloin tip roast, vegetable oil, white bread, ground chuck, deli ham and orange juice. The informal survey shows the total cost of 16 food items that can be used to prepare one or more meals was $53.28, down $.59 or about 1 percent compared to a survey conducted a year ago. Of the 16 items surveyed, ten decreased and six increased in average price. Egg prices are up sharply from first quarter of 2015, a year ago but are down even more sharply from the third quarter of 2015. This shows the effect of the HPAI (High Pathogenic Avian Influenza) event last year. Prices on the beef items in the marketbasket – ground chuck and sirloin tip roast – peaked in early 2015 at record high levels. Since then, a combination of increasing beef production, weaker exports, and lower competing meat prices have led to modest price declines. Dairy product prices also remain relatively low. At $4.29 for a one-pound bag, shredded cheddar cheese price is at the lowest price in this survey since the third quarter of 2012. The whole milk price rose almost 3 percent from the third quarter of last year, but that third quarter price was the lowest price in the survey since 2010. (Source: American Farm Bureau Federation) Marketbasket Survey


By |2016-03-24T11:23:26-05:00March 24th, 2016|Articles|0 Comments

Morning Summary

Macro traders are wondering if last weeks trend of crude oil moving higher and the U.S. dollar moving lower is only a brief anomaly or greater evidence of things to come? There’s a ton of moving parts this week so make certain you are paying very close attention. Below are the ones the trade seems most heavily focused on. These are also the headlines that will most directly impact the direction of the U.S. dollar and crude oil, hence ultimately deciding the overall direction of stocks and commodity prices:

  • Fed Meeting: Federal Reserve officials start their two-day meeting on Tuesday. Even though most inside the trade doubt we will see any type of rate hike, there’s a very strong chance we could see more hawkish type commentary and increased   thoughts of another rate hike between now and July. Keep in mind employment has strengthened as of late and inflation appears to have gained a little nearby momentum on higher prices at the pump. 
  • U.S. Presidential Campaign: The 2016 race is certainly heating up and drawing a ton of press and uncertainty amongst Wall Street traders. There’s a lot of talk as of late that the recent weakness in the U.S. dollar is a direct result of the uncertainty surrounding who will become the next U.S. president. With several “extreme” candidates still in contention the world is a bit on edge in regard to free trade, immigration, big banks, taxes, etc… The extreme “changes” being discussed make the trade nervous as nobody knows exactly how the worlds #1 economy will be altered during the next four years? Keep in mind there’s some huge presidential primaries this week in key states like Florida, Illinois, Missouri, North Carolina, and Ohio. Don’t forget some of these are “winner-take-all” states and could largely impact the race. 
  • Crude Oil & China: There’s a ton of Chinese economic data scheduled for release this week. IN fact over the weekend it was reported that China’s industrial production during the first two months of the year grew at its slowest rate since the global financial crisis. The figures were the weakest since November 2008.  Many insiders I speak with have had little confidence through the years in the accuracy of most Chinese data. This is why crude oil prices have been so heavily influential across the trade as of late. Many insiders believe the price of crude oil tells a more accurate story about the strength of the Chinese economy. Meaning the Chinese government can release whatever data they want and tell the world they are expecting +7% growth in GDP, but when crude oil prices are betting out and the world is seemingly swimming in a glut of over-supply, it’s tough to believe the numbers. Perhaps the recent turnaround and move higher in crude oil price is an indication the trade may have gotten a bit too bearish the Chinese economy and perhaps there are some signs of a recovery, or at least a chance their latest dovish policies changes by the government has stopped the bleeding? OPEC is scheduled to release its monthly oil market report today. Investors will be looking to see whether production increased in February and what the group’s projections are for full-year output. If you recall, Saudi Arabia and fellow OPEC members Qatar and Venezuela […]
By |2016-03-14T10:38:09-05:00March 14th, 2016|Articles|0 Comments
Go to Top