Articles

Home/Articles

These 10 States Will Be Hurting the Most After the Commodities Meltdown

In the brutal commodities meltdown, all U.S. states are not created equal.

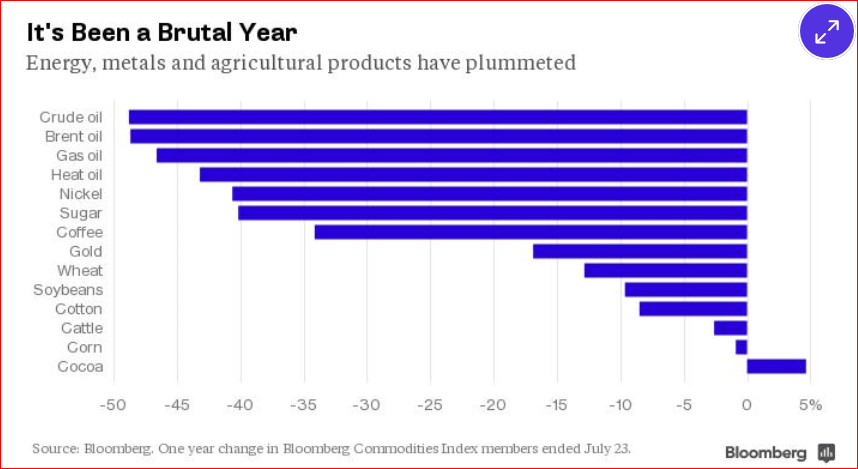
In fact, the impact has been vastly different. The Bloomberg Commodity Index last week reached a 13-year low and has plunged 61 percent since its peak in 2008. That matters a lot in, say, Wyoming, Louisiana, Texas and Nebraska. Not so much in New Jersey or Massachusetts, for example. The map below shows the top 10 states with the greatest exposure as measured by mining and agriculture’s share of the economy in 2014. The darker the color, the more the state’s economy is at risk.

Where it hurts the most

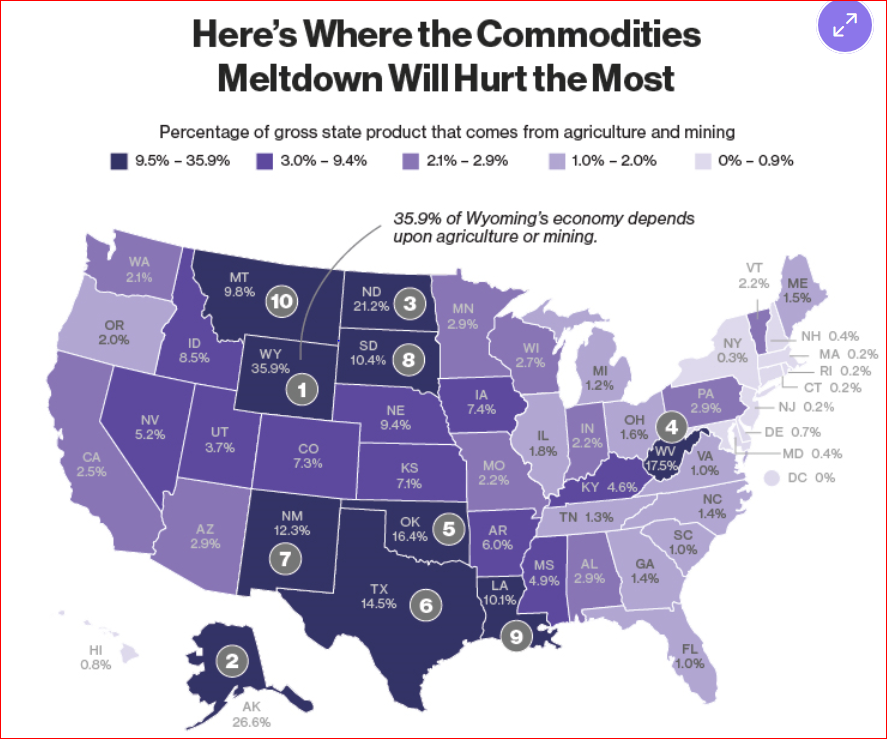
Wyoming is home to most of the top producing coal mines in the U.S. Its mining and agriculture industries generated 36 percent of its economic output in 2014, more than any other state, according to Moody’s Analytics’s calculations using Commerce Department data.

It's Been a Brutal Year


The top nine states on the map got  at least 10 percent of their gross state product from energy, mining and agriculture last year: Wyoming, Alaska, North Dakota, West Virginia, Oklahoma, Texas, New Mexico, Louisiana and South Dakota. Another six got more than 7 percent, compared to just 3.9 percent for the U.S. as a whole.

New Jersey, Massachusetts, New York, Rhode Island and Connecticut have almost none of their economies in those industries, just 0.3 percent or less.

A year ago, Federal Reserve policy makers and many private economists viewed falling oil prices as an economic boom that would boost consumer confidence and spending. While there’s been some evidence of that in restaurant sales for example, it’s been partly offset by the slowdown in mining and farming that has reduced employment in a checkerboard of states.

The commodities collapse has cut monthly employment gains in the U.S. by around 50,000 a month this year, estimates Mark Zandi, Moody’s chief economist in West Chester, Pennsylvania.

“Growth has slowed sharply in the commodities-producing parts of the country, most significantly in the energy sector,” Zandi said. “The very heady rates of growth of recent years have given way to pedestrian growth and in some places no growth at all.”

Farming has seen a less significant loss of jobs, but “we will see much weaker income numbers in agriculture-producing regions,” he said.

That’s also reduced wage growth in those states, Goldman Sachs Group Inc. economist David Mericle wrote in a report July 20.

While Federal Reserve Chair Janet Yellen has said there are tentative signs wages are picking up, “a counterpoint to this generally encouraging picture is that the shale states have seen major setbacks recently,” Mericle wrote.

Getting Drilled


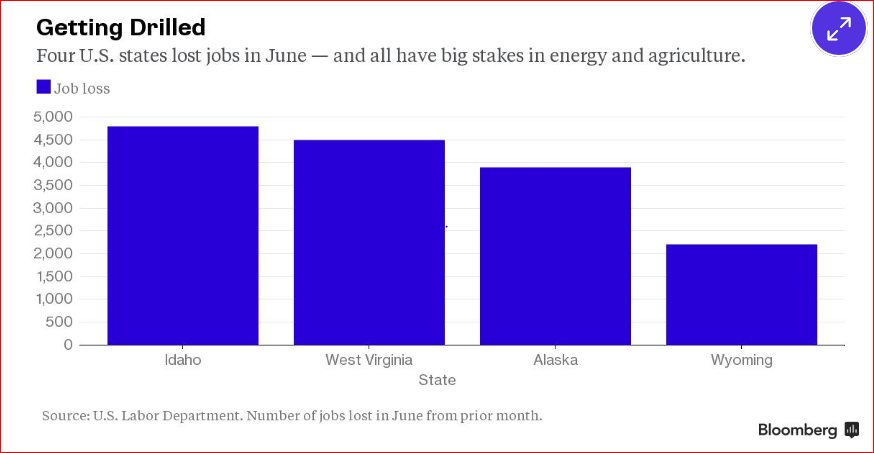
In June, there were job losses in Wyoming, West Virginia, Alaska and Idaho, states that all had more than twice as much of their economies tied to farming and mining than the […]

By |2015-07-28T08:33:09-05:00July 28th, 2015|Articles, Commodities|0 Comments

• Why We Still Need Rain:

  • Studies clearly show that rescue applications during the late vegetative stages can result in increased yields and economic returns. However, it is important to remember that dry conditions after the rescue N application can limit the effectiveness of additional N because water is needed to move N into the root zone. Is It Too Late? Nitrogen applications after R1 (silking) are generally not encouraged, as some studies have shown that economic yield response to N fertilization seldom occurs after pollination. However, under severe N deficiency, some response may occur to applications of low rates of N (30 to 60 pounds) as late as three weeks afteDue to Nitrogen Dificiencyr pollination (Thomison, 2010).
By |2015-07-21T13:15:05-05:00July 21st, 2015|Articles, Commodities|0 Comments

Food Fraud Is A Growing Favorite Of Crime Syndicates

From horse meat to seafood, food fraud is a growing problem worldwide. According to the World Customs Organization, food fraud is costing $49 billion annually. It is so lucrative, in fact, that drug cartels in South America and organized crime in Italy are involved in counterfeit groceries. Olive oil is recognized as the number one food product at risk of attracting the interest of organized crime. Crime syndicates are very stealth in keeping their schemes alive too – once one unlawful ingredient is detected, they move on to another. That makes it even harder for agencies trying to police the illegal trade, as they have to know what nefarious ingredient they are looking for in order to test for it.

Food Fraud

By |2015-07-15T12:14:48-05:00July 15th, 2015|Articles|0 Comments

U.S. ethanol makers race to expand even with policy uncertainty

Some U.S. ethanol producers are racing to bring on capacity, pushing output to fresh highs even as soaring corn prices tighten margins and the nation’s biofuels program faces prolonged uncertainty.

Betting on exports and robust domestic fuel demand, four companies are finalizing expansions and projects that will add 375 million gallons of corn-based ethanol capacity this year.

That’s the equivalent of adding some 24,000 barrels a day.

It is only a sliver of the nation’s nearly 1 million barrel per day output and small compared with expansions in recent years as companies raced to build after Washington launched the renewable fuels program in 2005.

Still, the new flows are expected to push output to fresh records at a time when inventories are near three-year highs and margins are beginning to buckle as corn prices rise.

They also come as the biofuels program faces a prolonged era of uncertainty. The Environmental Protection Agency in May unveiled long-awaited targets for biofuels use through 2016.

Attacks on the controversial policy are mounting. Oil refiners have threatened legal action to overhaul the program, and a U.S. lawmaker is considering a bid to defund the program.

Even so, Marquis Energy LLC is pushing ahead with its project to double capacity at its 150-million-gallon facility in Hennepin, Illinois, making it the largest U.S. dry-mill.

“We’ve got emerging world markets, gasoline demand is up,” said Marquis chief Mark Marquis in an interview.

The plant’s location and low costs will help it navigate tightening margins, Marquis said.

The expansion, four years in the making, will be complete in December.

NEW CAPACITY, NEW CAUTION

While consumption remains firm for now, rivals are watching the expansions with caution.

“Where’s all that ethanol going to go? I would say the market is a little bit nervous,” said Neil Koehler, co-founder and Chief Executive Officer of Pacific Ethanol Inc, which has eight plants with 515 million gallons of capacity.

Plant run-rates hit a record 994,000 barrels per day last month, partially as capacity has ramped up at facilities owned by Noble Group and by Ergon Biofuels.

Dakota Spirit AgEnergy, a $155 million project, is fine-tuning a 65-million-gallon ethanol plant, said Jeff Zueger, chief executive officer of Midwest AgEnergy Group.

Demand growth expectations – at least in the short term – are uncertain. Oil companies say that ethanol use in gasoline is capped at 10 percent of U.S. gasoline use projected to rise to 138.7 billion gallons this year.

Margins are already below 20 cents a gallon, half of the eight-year average of about 40 cents a gallon and down from records above $2 a gallon last year, according to Iowa State University.

Plants will be profitable so long as ethanol prices, now around $1.60 a gallon, stay above $1.

But once the summer driving season ends, many producers worry inventories will resume their rise, prices will fall and higher-cost producers may be forced to dial back or idle.

“Markets can be brutal. Depending on how quick and how brutal, you could have smaller players shutting down,” Koehler said. (Editing by Eric Walsh)

By |2015-07-08T10:43:52-05:00July 8th, 2015|Articles|0 Comments

Comparing Corn Production Expenses VS. Other Types of Farming

Lately, the USDA and its subsequent agencies have been putting out some nice data on the cost-of-production-side of farming. The most recent chart shows the variation in the percent of total expenses across different types of farms. I know that’s a mouthful, but the chart reflects how specialized US agriculture has become. While wide differences generally exist between crop and livestock farms, this new breakdown compares expenses within the major farm types. Livestock purchases are the largest component of total expenses for beef cattle farms, primarily because of the relatively high cost of feeder steers. In comparison, because of the lower cost of their animal purchases, feed expenses are the largest component of total expenses for other animal farms (primarily hog, poultry, and dairy). Specialty crop farms have a higher share of labor expenses than field crop farms, because they occupy fewer acres and are less mechanized. Other findings are fairly straightforward. For example, specialty crop farms have a higher share of labor expenses than field crop farms, because they occupy fewer acres and are less mechanized. In contrast, field crop farms, especially corn farms, spend a greater share directly on the crop including fertilizer, seeds and chemicals and rents. Interestingly, fuel expenses are relatively consistent, varying between 3% of total expenses for other animal farms to 8% for other field crop farms. This information comes the Agricultural Resource Management Survey (ARMS) which collects data at the field-level on production practices and costs (fertilizer, pesticide, labor, tillage, seed, etc.) for target commodities. The survey collects information from 48 States and is designed to be representative of the continental US and to support State-level estimates for 15 key agricultural States.Production Expenses on Farm

By |2015-07-02T07:41:50-05:00July 2nd, 2015|Articles|0 Comments
Go to Top